In 2018, I spent one year writing an Honours thesis in Pure Mathematics to complete my Bachelor of Science (Advanced Mathematics) (Honours) at UNSW Sydney. I was supervised by the amazing Professor Catherine Greenhill. The title of the thesis is Spanning Trees in Random Regular Uniform Hypergraphs. We have published a paper with our results in Combinatorics, Probability & Computing.
Click here to have a read of my thesis.
I’ll attempt to explain the results of my thesis below to an audience with no mathematical background. For those who are more mathematically inclined, I will write up a more technical version soon.
A primer
My thesis aimed to answer the following question: How many spanning trees are there in a random \(r\)-regular \(s\)-uniform hypergraph on \(n\) vertices? Let’s unpack what this means.
Graph theory
I have been working in an area of mathematics known as graph theory. A graph is a mathematical structure which captures pairwise relations between objects. A graph is made up of vertices (or nodes) which are connected by edges (or links). We usually represent them as dots and lines.


Graphs can be used to model any physical, biological or social system where it is important to understand the pairwise relationships. Euler’s paper on the Seven Bridges of Königsberg, published in 1736, is regarded as the first paper on graph theory. The problem was to devise a walk through the city of Königsberg which would cross each of the seven bridges exactly once (see Figure 2). Euler proved that the problem has no solution.

Since then, graphs have become one of the most basic structures in the study of discrete mathematics. Some areas where graphs have been applied include:
- Modelling streets and traffic flow. Let the vertices of the graph be the street corners of a city and draw an edge from one vertex to another if there is a street connecting them. We can ask questions like: Is there a way to rearrange the street directions to optimise traffic flow? What is the route for a street cleaner which allows them to clean all the streets in the shortest amount of time? What is the most efficient way to get from A to B?
- Social networks. Let the vertices of the graph be the users of Facebook and draw an edge between two users if they are “friends”. We can ask questions like:
- Is the “six degrees of separation” theory true? (It turns out the average “degree of separation” is 3.5.)
- How much “clustering” is there in this graph?
- How quickly does information spread through this network?
- Criminology. Let the vertices of the graph be the members of a criminal network, and draw an edge between two members if there is evidence of a connection. Each member has different levels of human capital (e.g. skills, expertise) and social capital (e.g. knowing more people). What is the most effective way of “disrupting” this network? This paper answers this very question.
- Map colourings. One of the most famous problems in graph theory is the four colour problem. Is it true that any map drawn on a plane can be coloured with four colours, such that two regions that share a common border have different colours? This is a graph theory problem if you let the vertices of the graph be the regions, and draw an edge between two regions which share a border. First posed in 1852 by Guthrie, it remained unsolved for over a century until, in 1976, Appel and Haken showed that the answer is yes. It was the first major theorem to be proven using a computer.
Trees and cycles
A cycle is a graph which is like a path which gets you back to where you started without repeating any vertices.
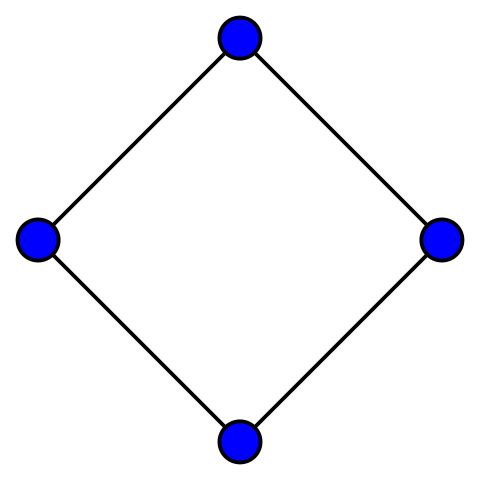

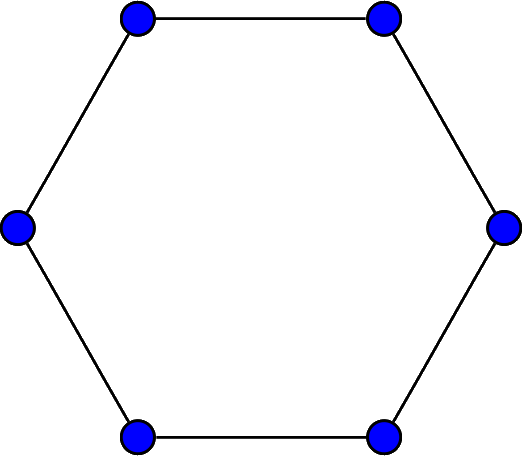
A spanning tree of a graph is a subgraph which is the smallest subgraph which connects every vertex. Such a subgraph does not have any cycles. Figure 4 shows an example of a spanning tree of the 4×4 grid graph.
We are interested in the number of spanning trees in a particular graph.
Random graphs
In 1959, Erdős and Rényi introduced what is now called the probabilistic method to prove the existence of graphs with certain properties. The idea is to look at a subset of all the graphs with \(n\) vertices, and pick one at random. The probability distribution that you apply is up to you. One way to generate random graphs is via the Gilbert model (1959).
- Fix a number \(p\) between 0 and 1.
- Start with an empty graph with \(n\) vertices.
- For each pair of vertices (there are \(\frac{n(n-1)}{2}\) of them), add an edge between them with probability \(p\).
Example
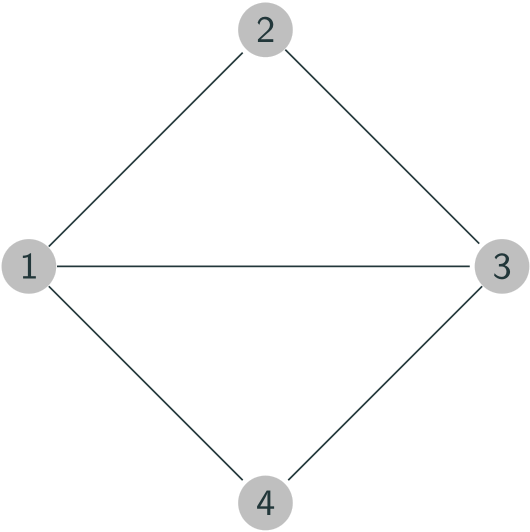
For example, if \(p = \frac{1}{2}\) and \(n = 4\), then for each pair of vertices, we “flip a coin”. Let’s say heads mean yes and tails means no.
| Pair of vertices | 12 | 13 | 14 | 23 | 24 | 34 |
| H or T? | H | H | H | H | T | H |
The number of spanning trees in random regular graphs
An \(r\)-regular graph is one where each vertex has an edge with \(r\) other vertices. Think of social network where everyone has the same number of friends.


Let’s say we have \(n\) vertices and pick a random \(r\)-regular graph, with each regular graph having an equal probability of being chosen. To do this, we have to use another model called the configuration model. Greenhill, Kwan and Wind (2014) showed that, when \(r \ge 3\), the expected number of spanning trees in such a random graph approaches
$$\exp\left( \frac{6r^2-14r+7}{4(r-1)^2} \right) \frac{(r-1)^{1/2}}{n(r-2)^{3/2}} \left( \frac{ (r-1)^{r-1}}{(r^2 – 2r)^{r/2-1}}\right)^n.$$
as \(n\) approaches infinity. To understand this more simply, let \(r = 3\). So we pick a random \(3\)-regular graph on \(n\)-vertices. Then the expected number of spanning trees it will have is well-approximated by the following formula as \(n\) gets big:
$$ \frac{\sqrt{2} e^{19/16} }{n} \left( \frac{4}{\sqrt{3}} \right)^n.$$
In fact, not only did they find the expected number of spanning trees, they found an asymptotic expression for the probability distribution of the number of spanning trees, but only for the case \(r=3\). They did this through a method called the small subgraph conditioning method. They conjectured a corresponding results for \(r \ge 4\).
The first major result of my thesis was to prove this conjecture.
Generalising to hypergraphs
A hypergraph is like a graph, but edges are allowed to contain more than 2 vertices. These structures can be very complicated very quickly, so we usually like to restrict ourselves to \(s\)-uniform hypergraphs, where each edge contains \(s\) vertices. In fact, a graph is just a \(2\)-uniform hypergraph.
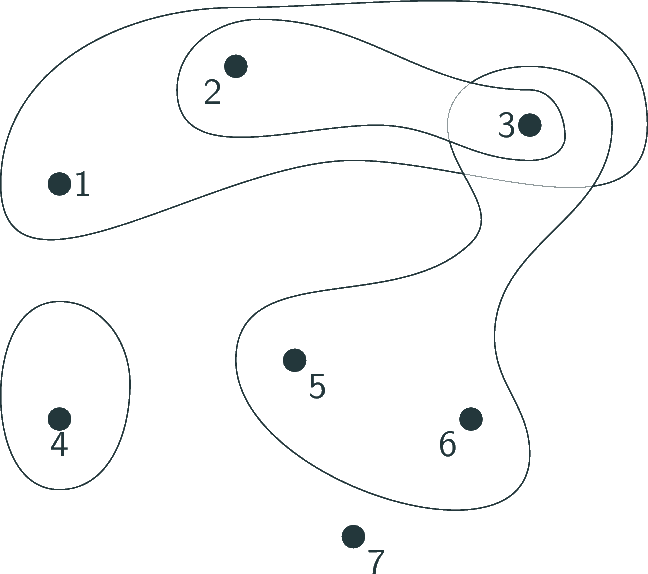
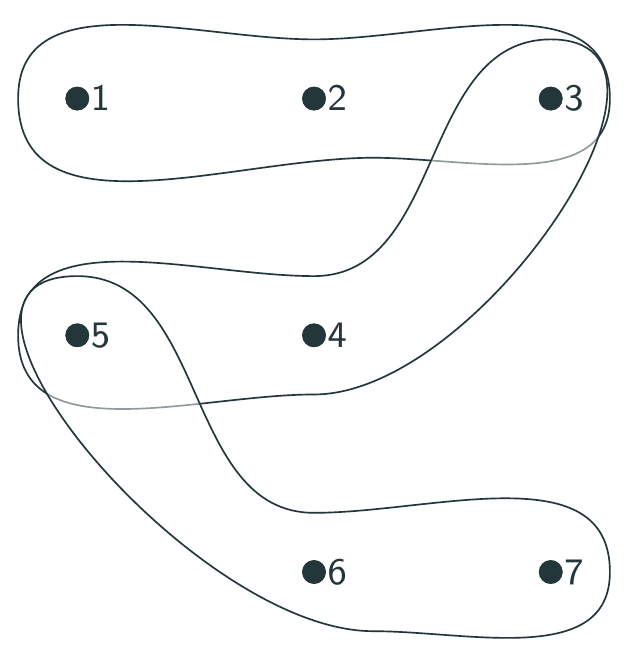
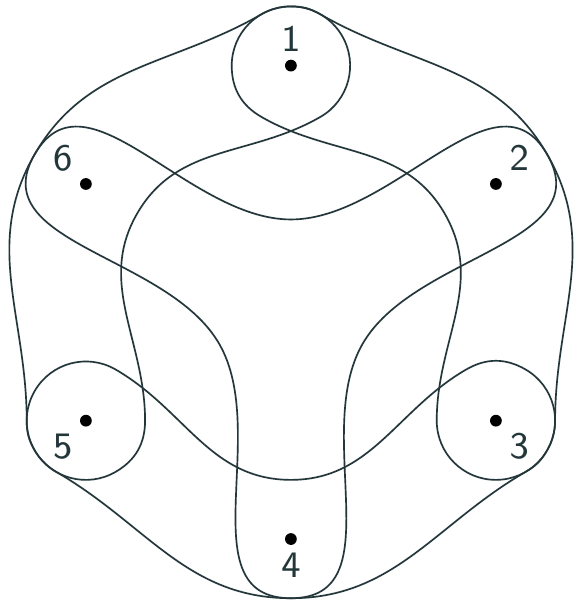
Similar to before, we look at the set of \(r\)-regular, \(s\)-uniform hypergraphs on \(n\) vertices, and pick one at uniformly at random. How many spanning (hyper)trees would you expect in this random hypergraph?
The second major result of my thesis was showing that the answer to this question depends on the value of \(r\) and \(s\). What I proved was that, if \(r\) is below than a certain threshold which depends on \(s\), then, we would expect there to be zero spanning trees in a random hypergraph. This intuitively makes sense: if \(r\) is small relative to \(s\), then each vertex is contained in less edges, so there are less edges overall and therefore, you would expect less trees.
My thesis also conjectured an expression for the asymptotic distribution of the number of spanning trees in a random regular uniform hypergraph, The conjecture hinges on finding the unique global maximum of a particular function. This proved to be very tricky, and I couldn’t do it during my Honours year. We brought on Mikhail Isaev to help us crack it and he managed it!